
… they would quickly realize that the Covid
‘vaccines’ are extremely toxic, injurious,
and often fatal. Hence, any physician who
participates in a such a risky and dangerous
experiment is administering a poisonous
injection to their trusting patients, thereby
profoundly violating their quite sacred
Hippocratic Oath.
Submitted by The Covid Coach
All of the following COVID-19 ‘vaccine’ data and information comes directly from the U.S. Federal Government’s Vaccine Adverse Event Reporting System (VAERS).
The Vaccine Adverse Event Reporting System (VAERS) is a United States program for vaccine safety, co-managed by the U.S. Centers for Disease Control and Prevention (CDC) and the Food and Drug Administration (FDA).[1] VAERS is a postmarketing surveillance program, collecting information about adverse events (possible harmful side effects) that occur after administration of vaccines to ascertain whether the risk–benefit ratio is high enough to justify continued use of any particular vaccine.
VAERS, the Vaccine Safety Datalink, and the Clinical Immunization Safety Assessment (CISA) Network are tools by which the CDC and FDA monitor vaccine safety[2] to fulfill their duty as regulatory agencies charged with protecting the public.(Source: Vaccine Adverse Event Reporting System)
(Source: Vaccine Adverse Event Reporting System)
Here, let the data speak for itself. In order to enlarge any of the graphs and tables posted below, please click on this link: Download as PDF.
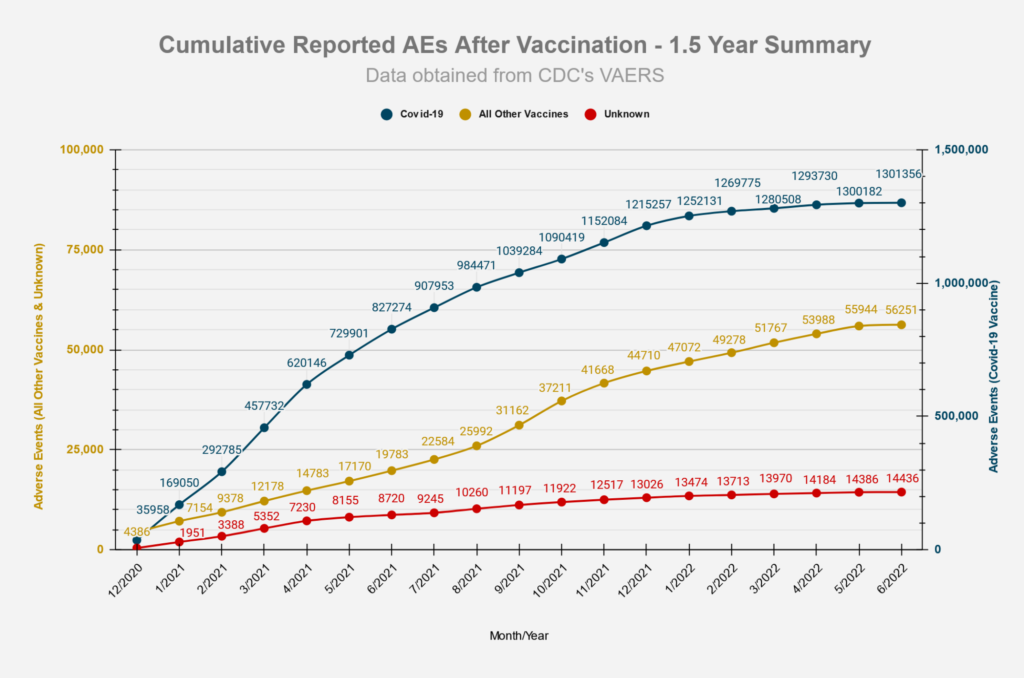
VAERS Summary for COVID-19 Vaccines through 6/10/2022
Posted by VAERSAnalysis.info
Weekly analysis of the VAERS data
All charts and tables below reflect the data release on 6/17/2022 from the VAERS website, which includes U.S. and foreign data, and is updated through: 6/10/2022
| High-Level Summary | COVID19 vaccines (Dec’2020 – present) | All other vaccines 1990-present | US Data Only COVID19 vaccines (Dec’2020 – present) |
US Data Only All other vaccines 1990-present |
|---|---|---|---|---|
| Number of Adverse Reactions | 1,301,356 | 884,544 | 831,801 | 768,645 |
| Number of Life-Threatening Events | 32,241 | 14,576 | 12,776 | 10,000 |
| Number of Hospitalizations | 163,121 | 84,524 | 63,978 | 39,333 |
| Number of Deaths | 28,859* | 9,814* | 13,293 | 5,362 |
| # of Permanent Disabilities after vaccination | 53,989 | 21,157 | 14,232 | 13,067 |
| Number of Office Visits | 195,200 | 51,719 | 163,625 | 49,370 |
| # of Emergency Room/Department Visits | 130,191 | 213,490 | 100,231 | 203,823 |
| # of Birth Defects after vaccination | 1,101 | 199 | 515 | 108 |
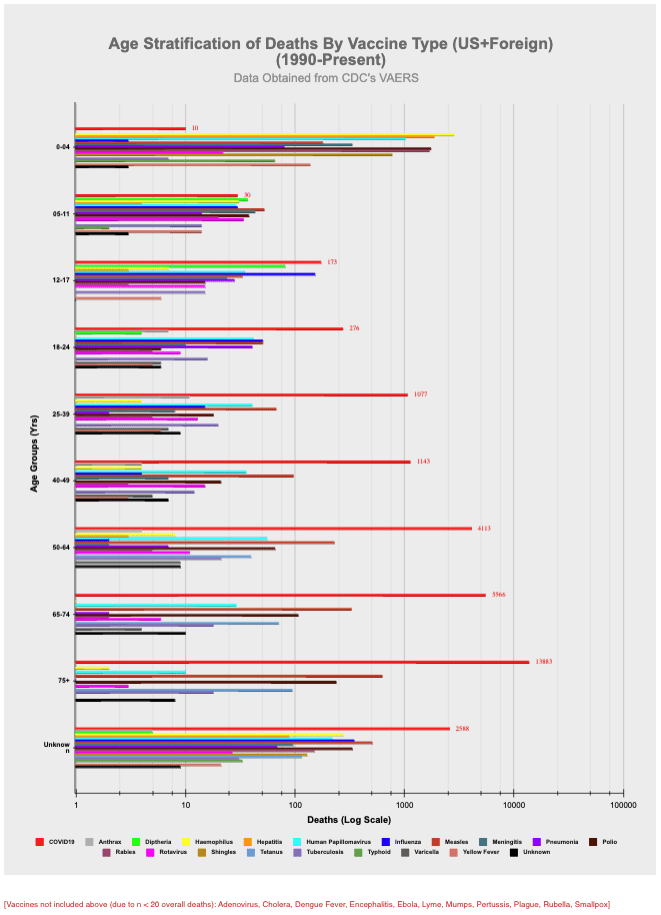
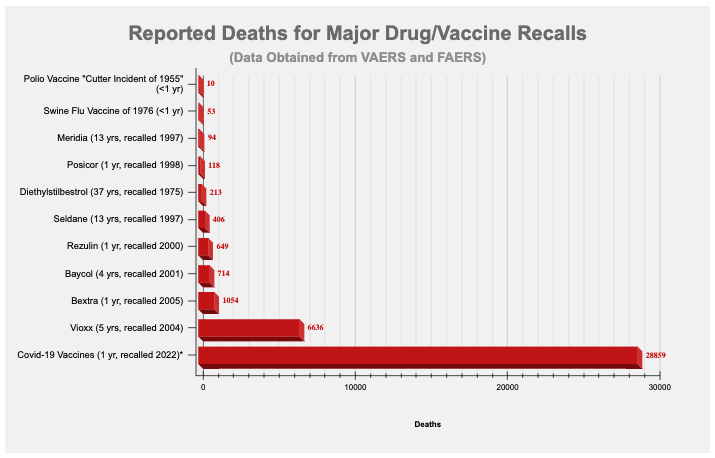
Deaths


[Vaccines not included above (due to n < 20 overall deaths): Adenovirus, Cholera, Dengue Fever, Encephalitis, Ebola, Lyme, Mumps, Pertussis, Plague, Rubella, Smallpox]
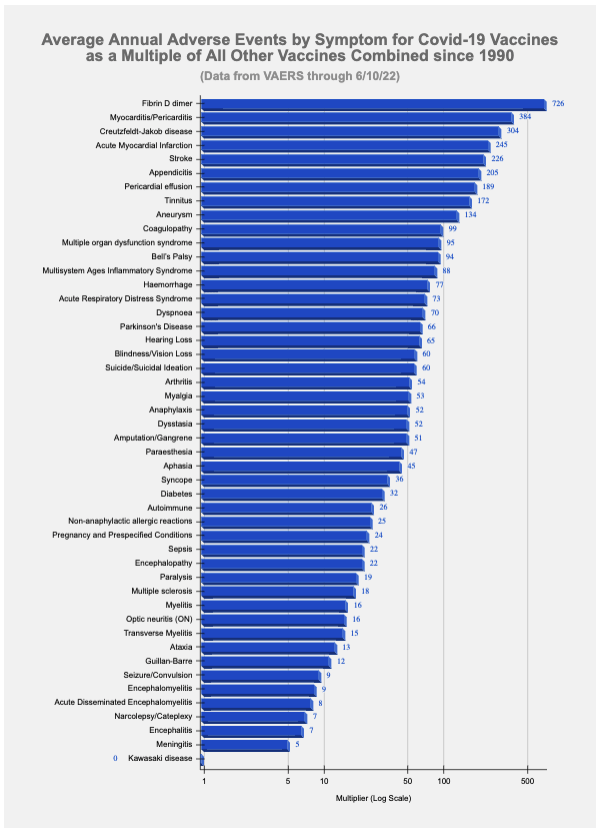
Adverse Events


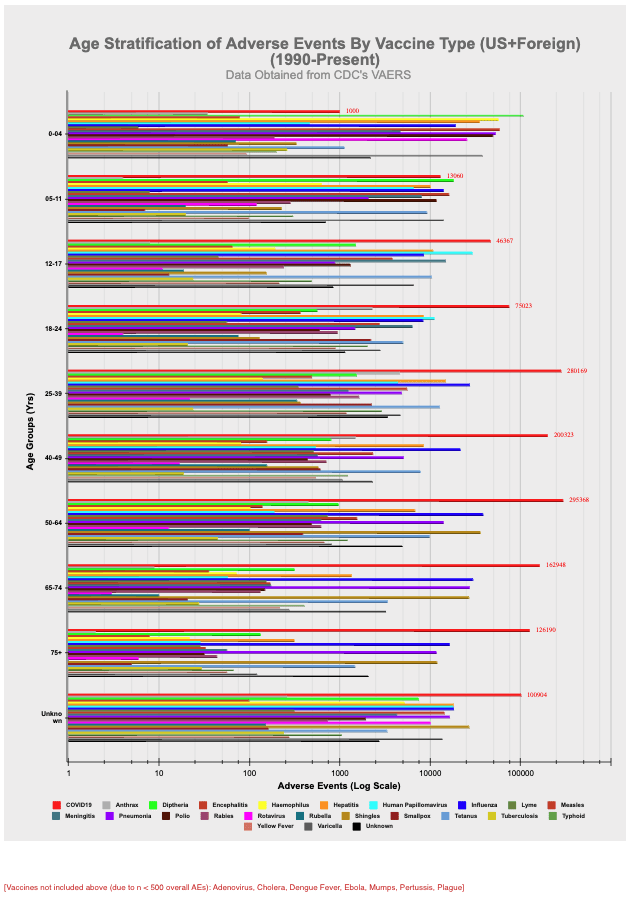
[Vaccines not included above (due to n < 500 overall AEs): Adenovirus, Cholera, Dengue Fever, Ebola, Mumps, Pertussis, Plague]
Symptoms
The slide below was taken from an FDA document from October 22, 2020 and provides a list of possible adverse event outcomes related to the Covid-19 vaccines.
- Source: ‘Vaccines and Related Biological Products Advisory Committee October 22,2020 Meeting Presentation”.
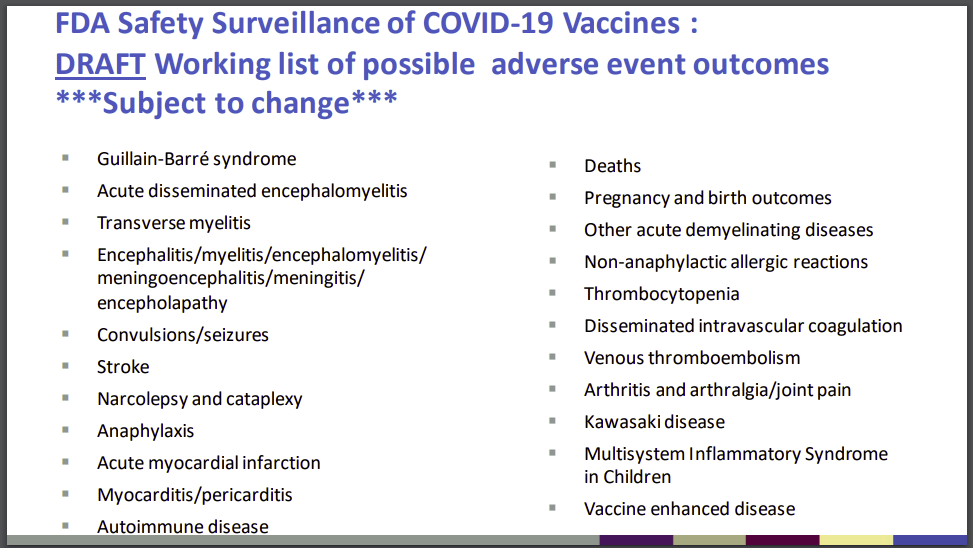
The following table lists the number of adverse events found in the VAERS data which match the outcomes listed above:
| FDA Listed Symptom | Total (Non-Lethal) Adverse Events for Covid-19 Vaccine |
Total Deaths for Covid-19 Vaccine | Total (Non-Lethal) Adverse Events for All Other Vaccines (1990-present) | Total Deaths for All Other Vaccines (1990-present) |
|---|---|---|---|---|
| Guillain-Barre | 2713 | 54 | 4490 | 141 |
| Acute Disseminated Encephalomyelitis | 202 | 7 | 448 | 30 |
| Transverse Myelitis | 612 | 5 | 843 | 15 |
| Encephalitis | 2504 | 325 | 4867 | 465 |
| Convulsions/Seizures | 16094 | 523 | 29987 | 523 |
| Stroke | 15741 | 1418 | 1613 | 111 |
| Narcolepsy, Cataplexy | 306 | 6 | 384 | 3 |
| Anaphylaxis | 49437 | 185 | 41318 | 163 |
| Acute Myocardial Infarction (Heart Attack) | 5198 | 1474 | 341 | 154 |
| Myocarditis/Pericarditis | 22510 | 313 | 976 | 88 |
| Autoimmune Disease | 1911 | 32 | 1112 | 16 |
| Other Acute Demyelinating Diseases | 380 | 7 | 859 | 25 |
| Pregnancy and birth outcomes (Miscarriages) | 4488 | 144 | 2895 | 49 |
| Other Allergic Reactions | 2395 | 3 | 2064 | 3 |
| Thrombocytopenia | 5966 | 458 | 3598 | 132 |
| Disseminated Intravascular Coagulation | 260 | 82 | 60 | 25 |
| Venous Thromboembolism | 24970 | 1478 | 674 | 113 |
| Arthritis and Arthralgia/Joint Pain | 79791 | 265 | 29029 | 78 |
| Kawasaki Disease | 94 | 2 | 717 | 9 |
| Systemic Inflammatory Response Syndrome | 876 | 61 | 366 | 5 |
Vaccination Related Risks of COVID19 Vs. Flu
These set of figures compare the COVID19 vaccine to the traditional Flu vaccines. ‘Risk of Death’ percentages depend on the ‘# of Vaccinations’ data, which is only approximate, and was pulled from the CDC’s report on Flu vaccination coverage for the 2019-2020 season, and from CDC’s Vaccination Trends in the US for the COVID19 vaccinations.
Covid19 vaccinations through 5/31/2021 vs. Flu vaccinations 7/1/2019 – 5/31/2020 (last complete flu season)
| Vaccine Type | # of Vaccinations[3] | # of Deaths | Risk of Death | Percentage | Deaths/Mill. Vaccinations[3] |
|---|---|---|---|---|---|
| Flu | 167,447,642[1] | 33 | 1 in 5,074,171 | 0.000020% | 0.20 |
| COVID19 | 173,336,401[2] | 5,784 | 1 in 29,968 | 0.003337% | 33.37 |
| Vaccine Type | # of Vaccinations[3] | # of Adverse Reactions | Risk of Adverse Reaction | Percentage | AEs/Mill. Vaccinations[3] |
|---|---|---|---|---|---|
| Flu | 167,447,642 | 9,726 | 1 in 17,216 | 0.005808% | 58.08 |
| COVID19 | 173,336,401 | 564,595 | 1 in 307 | 0.325722% | 3,257.22 |
[1] number of flu vaccinations based on estimated flu vaccine coverage data from CDC and estimated population data from US Census. Yearly flu vaccination data covers a period of time from 7/1 to 5/31 of the following year.
[2] number of covid19 vaccinations based on estimates from CDC’s Vaccination Trends in the US [2]
[3] Persons vaccinated with at least one dose.

Vaccine Data by Manufacturer
| Manufacturer | # of Deaths | % Deaths | Average Deaths/Day | # US Deaths | US Doses Administered | Average US Deaths/Mill. Doses | Days since EUA approval | EUA Approval Date- |
|---|---|---|---|---|---|---|---|---|
| JANSSEN | 2,493 | 8.61% | 5.32 | 1,621 | 18,811,735 | 86.17 | 469 | 2/26/21 |
| MODERNA | 7,581 | 26.19% | 14.06 | 5,558 | 223,409,934 | 24.88 | 539 | 12/18/20 |
| PFIZER\BIONTECH | 18,719 | 64.67% | 34.28 | 6,096 | 349,460,399 | 17.44 | 546 | 12/11/20 |
| UNKNOWN MANUFACTURER | 153 | 0.53% | 52 | 587,184 |
| Manufacturer | # of AEs | % AEs | Average AEs/Day | # US AEs | US Doses Administered | Average US AEs/Mill. Doses | Days since EUA approval | EUA Approval Date |
|---|---|---|---|---|---|---|---|---|
| JANSSEN | 89,204 | 6.83% | 190.2 | 69,281 | 18,811,735 | 3682.86 | 469 | 2/26/21 |
| MODERNA | 454,057 | 34.76% | 842.41 | 379,392 | 223,409,934 | 1698.19 | 539 | 12/18/20 |
| PFIZER\BIONTECH | 758,129 | 58.03% | 1388.51 | 383,111 | 349,460,399 | 1096.29 | 546 | 12/11/20 |
| UNKNOWN MANUFACTURER | 5,029 | 0.38% | 2,627 | 587,184 |
Vaccine Data by Gender

Vaccine Data by Location


Recall History
Sources
- Vaccine data (Covid-19 and other vaccines) taken from CDC’s VAERS website, located here: https://vaers.hhs.gov/data/datasets.html. VAERS data sets in the form of csv files are pulled down weekly and put into a database for reporting/analysis. Data files are available all the way back to 1990.
- Number of doses distributed for other vaccines found in NVICP Data and Statistics report here: https://www.hrsa.gov/sites/default/files/hrsa/vaccine-compensation/data/data-statistics-report.pdf
- Numbers for Covid-19 vaccines administered by manufacturer found here: https://covid.cdc.gov/covid-data-tracker/#vaccinations_vacc-total-admin-rate-total
- Numbers for total Covid-19 vaccine doses administered found here: https://data.cdc.gov/Vaccinations/COVID-19-Vaccination-Trends-in-the-United-States-N/rh2h-3yt2
- Numbers for Flu vaccine doses administered for 2019-2020 season found here: https://www.cdc.gov/flu/fluvaxview/coverage-1920estimates.htm
- Numbers for FDA regulated drugs taken from FDA’s FAERS website, located here: https://www.fda.gov/drugs/questions-and-answers-fdas-adverse-event-reporting-system-faers/fda-adverse-event-reporting-system-faers-public-dashboard
Other Important Posts
- Some VAERS records are deleted every week:
- VAERS throttles data and also removes records before ever releasing them (death record of 2 year old was never published):
- Best evidence of harm from Covid-19 vaccines using specific examples from VAERS:
- 37 examples from this post (from 2/22/22): https://vaersanalysis.info/2022/02/03/the-best-evidence-of-vax-related-deaths-in-vaers-part-ii-and-a-history-lesson-courtesy-of-vioxx/
- 41 examples from this post (from 10/4/21): https://vaersanalysis.info/2021/10/04/the-best-vaers-evidence-of-covid-19-vax-related-deaths/
- Downloadable excel showing frequency of all the symptoms associated with Covid-19 vaccines:
- Hot Lot information (including downloadable excel with all the lot numbers and frequency of adverse events):
- Deaths and adverse events broken down by state:
- Exposing the fraud in the Pfizer clinical trial:
- Breakdown of VAERS reporting percentages by medical professionals vs. laypeople:
- Lack of quality control of the VAERS data:
- Safety of alternative treatments for Covid-19:
___
https://vaersanalysis.info/2022/06/17/vaers-summary-for-covid-19-vaccines-through-6-10-2022/
_____
VAERS-Summary-06102022
KEY POINT: Don’t forget, these Covid ‘vaccine’-caused
deaths and injuries only represent 1% to 10% of the actual
number, because the vast majority of vaccine injuries are
NEVER reported by the victims, their families or friends,
the attending physician, the ER or urgent care facility,
the local hospital or medical center, etc. In fact, America’s
healthcare institutions are not even encouraged to submit
or share this exceedingly important life-saving info/data.
Conclusion
The preceding statistical report on COVID-19 ‘vaccines’ has been factually reviewed and found to be the most authoritative review of it kind on the Internet today.
The only conclusion that any medical doctor or physician specialist could draw from this vital data/info is that the COVID-19 vaccine program, which was rolled under under the rubric of Operation Warp Speed, was done so in a manner so as to cause great harm and death to the American people.
Therefore, it is imperative that those medical doctors who are supporting this disastrous public health initiative cease and desist from doing so—POSTE HASTE. No healthcare professional would ever want to collaborate, witting or unwittingly, in executing what is essentially a highly organized and preplanned depopulation program.
The Covid Coach
June 21, 2022